
There comes a point where your marketing starts to feel… overwhelming.
You’re running ads.
Sending emails.
Posting on social media.
Managing funnels.
Data is everywhere.
But clarity?
👉 Nowhere.
You open multiple dashboards. You check different tools. You try to connect numbers in your head.
And still, one question remains unanswered:
👉 “What is actually driving my growth?”
Because in modern marketing, the biggest problem is not lack of data.
👉 It’s lack of connected insight.
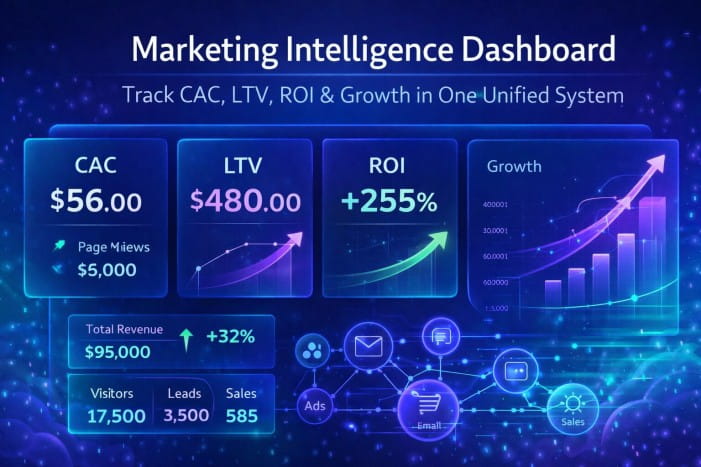
That’s exactly why the Marketing Intelligence Dashboard exists.
Marketing Intelligence Dashboard (Super Tool)
It’s not just another tool.
👉 It’s your entire marketing system—simplified into one decision engine.
Why Most Marketing Data Feels Useless
At first, everything looks organized.
You have:
- Ad reports
- Email analytics
- Funnel data
- Social media insights
But these systems don’t talk to each other.
So you end up with:
- High traffic but low profit
- Good engagement but low conversion
- Strong ROI in one channel, loss in another
And no clear answer why.
This is the core problem.
👉 Disconnected data leads to disconnected decisions.
What Is a Marketing Intelligence Dashboard?
A marketing intelligence dashboard brings all your key metrics into one unified system.
Instead of checking 5 tools…
👉 You see everything in one place:
- Customer acquisition cost (CAC)
- Customer lifetime value (LTV)
- ROI & ROAS
- Conversion rates
- Traffic & engagement
- Revenue & growth
But more importantly…
👉 It connects them.
Because individually, metrics are just numbers.
Together, they tell a story.
The Problem With Tracking Metrics in Isolation
Let’s say:
- Your ads have good ROAS
- Your funnel has decent conversion
- Your traffic is growing
Everything looks fine.
But when you combine them:
👉 CAC is increasing
👉 LTV is decreasing
👉 Profit is shrinking
This is what isolated tracking hides.
And this is exactly what this dashboard solves.
How This Marketing Intelligence Dashboard Works
This tool is designed to unify your entire marketing system.
You input:
Business Data:
- Total Revenue
- Total Costs
Marketing Channels:
- Ad Spend & Revenue
- Email Campaign Data
- Other channel performance
Customer Data:
- Total Customers
- New Customers
- Lost Customers
Funnel Data:
- Visitors
- Leads
- Sales
From this, the system calculates:
- CAC
- LTV
- ROI
- ROAS
- Conversion rates
- Growth metrics
But more importantly…
👉 It shows relationships between them.
From Metrics to Meaning (Where This Tool Becomes Powerful)
Most dashboards stop at reporting.
This one explains.
For example:
👉 “Your ads generate revenue but CAC is rising—optimize targeting”
👉 “Your email channel has the highest ROI—scale it”
👉 “Your funnel conversion is weak—this is limiting growth”
This is what makes it an intelligence system, not just analytics.
The Core Metrics That Drive Everything
To understand your business, you need to connect these key metrics:
Customer Acquisition Cost (CAC)
How much you spend to acquire one customer.
Customer Lifetime Value (LTV)
How much revenue a customer generates over time.
ROI & ROAS
How efficiently your marketing converts spend into revenue.
Conversion Rate
How effectively your funnel turns visitors into customers.
Traffic Value
How much your traffic is actually worth.
Individually useful.
👉 Together—powerful.
- Email Marketing
The Complete Guide to Lead Generation and Cold Email Marketing eBook PDF
Original price was: 5.00$.0.00$Current price is: 0.00$. Add to cart - Email Marketing
Atlas Bulk Email Sender | Powerful Unlimited SMTP Email Marketing Software for Windows
Price range: 0.00$ through 59.00$ Select options This product has multiple variants. The options may be chosen on the product page - WhatsApp Marketing
Lead Wave WhatsApp Marketing Software with AI Chatbot & Automation
Price range: 0.00$ through 299.00$ Select options This product has multiple variants. The options may be chosen on the product page - Marketing Tools
Bulk Pilot – A Simplified WhatsApp Marketing Tool for Efficient Automation
Price range: 0.00$ through 59.00$ Select options This product has multiple variants. The options may be chosen on the product page - Telegram Marketing
TGTools Telegram Marketing Software for Messaging Automation
Price range: 0.00$ through 99.00$ Select options This product has multiple variants. The options may be chosen on the product page - WhatsApp Marketing
WaDefender WhatsApp Account Strength Analyzer & Safety Software
Price range: 0.00$ through 99.00$ Select options This product has multiple variants. The options may be chosen on the product page - WhatsApp Marketing
Wasender Bulk WhatsApp Sender Software for Business Communication
Price range: 0.00$ through 199.00$ Select options This product has multiple variants. The options may be chosen on the product page


Why This Dashboard Changes How You Make Decisions
Without this tool:
- You guess what’s working
- You rely on incomplete data
- You make reactive decisions
With this tool:
- You see the full picture
- You identify bottlenecks
- You prioritize correctly
This shifts your entire strategy.
Channel Comparison: Where Real Insights Happen
One of the most powerful features is channel comparison.
You can see:
- Ads vs Email
- Social vs Organic
- Paid vs Owned channels
For example:
👉 Ads → High cost, moderate ROI
👉 Email → Low cost, high ROI
Now the decision is obvious.
👉 Scale email
👉 Optimize ads
This is how you allocate budget intelligently.
Funnel Visibility: Where You’re Losing Customers
Your funnel is where conversion happens.
This dashboard shows:
👉 Visitors → Leads → Sales
And identifies:
👉 Where users drop off
👉 Where conversion is weak
Instead of guessing, you know exactly where to optimize.
Growth vs Efficiency: The Balance Most Businesses Miss
Many businesses focus only on growth.
More traffic.
More ads.
More campaigns.
But ignore efficiency.
This leads to:
- High spend
- Low profit
- Unstable growth
This dashboard balances both:
👉 Growth + Profitability
Why Most Businesses Scale Wrong
They scale based on:
- Revenue
- Traffic
- Short-term results
But ignore:
- CAC
- LTV
- Profit margins
This leads to scaling into loss.
This tool prevents that.
Forecasting: Seeing Your Future Before It Happens
One of the most powerful features is forecasting.
Based on your current data, the dashboard predicts:
👉 “If this continues, your revenue will grow by X%”
👉 “If CAC increases, profit will decline”
This gives you:
👉 Predictability
And predictability is power.
The Emotional Shift: From Chaos to Clarity
Without a unified system:
- You feel overwhelmed
- You doubt your strategy
- You hesitate to scale
With this dashboard:
- You see everything clearly
- You understand what works
- You act with confidence
This changes how you run your business.
Why This Is More Than Just a Tool
This is not a calculator.
It’s not a simple dashboard.
👉 It’s a decision engine
It helps you answer:
- Where should I invest more?
- What is hurting my growth?
- What should I fix first?
And that clarity is rare.
Turn Your Marketing Into a System
Most businesses operate in chaos.
Random campaigns.
Disconnected tools.
Unclear decisions.
This dashboard turns everything into a system.
- Data becomes insight
- Insight becomes action
- Action becomes growth
Start Seeing Your Business Clearly
Your data already exists.
Your campaigns are already running.
Your numbers are already there.
The only question is:
👉 Are you connecting them?
Use this Marketing Intelligence Dashboard to track your customer acquisition cost, customer lifetime value, ROI, and overall growth—all in one place.
Because in modern marketing…
👉 Data is everywhere
👉 But clarity wins
