
You launch ads. You spend money. You see clicks coming in.
And for a moment, everything feels like it’s working.
But then a question slowly starts creeping in:
👉 “Am I actually making money… or just spending it faster?”
Because here’s the uncomfortable truth about advertising—
Revenue doesn’t always mean profit.
And without understanding your numbers, especially customer acquisition cost, ROAS, and ROI, you can scale your campaigns straight into loss.
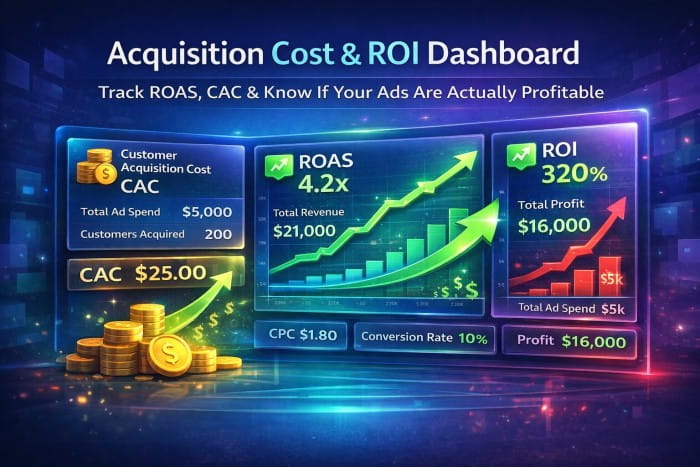
That’s exactly why the Acquisition Cost & ROI Dashboard exists.
Acquisition Cost & ROI Dashboard
It doesn’t just track performance.
👉 It tells you whether your ads deserve more budget… or should be stopped immediately.
The Real Problem With Most Ad Campaigns
Most marketers track the wrong things.
They focus on:
- Clicks
- Impressions
- Traffic
And while those numbers look impressive, they don’t answer the most important question:
👉 “Is this campaign profitable?”
Because you can have:
- High clicks
- Good engagement
- Even decent conversions
…and still lose money.
This is where metrics like ROAS formula, customer acquisition cost, and ROI become critical.
Why You Need to Track Customer Acquisition Cost First
Customer Acquisition Cost (CAC) tells you how much you spend to acquire one customer.
👉 CAC = Total Ad Spend ÷ Customers Acquired
If you spend $1,000 and get 100 customers:
👉 CAC = $10
On its own, that number doesn’t mean much.
But when combined with revenue…
👉 it becomes powerful.
The Metric Everyone Talks About: ROAS (Return on Ad Spend)
ROAS is one of the most searched and misunderstood metrics.
👉 ROAS = Revenue ÷ Ad Spend
If you spend $1,000 and generate $4,000:
👉 ROAS = 4x
That sounds great.
But here’s where most people get it wrong—
👉 ROAS is not profit.
It only shows revenue efficiency—not actual profitability.
ROI vs ROAS: What’s the Difference (And Why It Matters)
This is where clarity becomes essential.
ROAS shows how much revenue you generate per dollar spent.
ROI shows actual profit.
👉 ROI = ((Revenue − Cost) ÷ Cost) × 100
You can have a high ROAS but still have a low ROI if your costs are high.
This is why the Acquisition Cost & ROI Dashboard tracks both.
How This Acquisition Cost & ROI Dashboard Works
This tool is designed to simplify complex ad analysis.
You input:
Ad Data:
- Total Ad Spend
- Clicks
- Impressions
Conversion Data:
- Leads
- Customers
Revenue Data:
- Total Revenue
- Optional product cost
From this, the tool calculates:
- Customer Acquisition Cost
- Cost Per Click (CPC)
- Conversion rates
- ROAS
- ROI
- Profit
But more importantly…
👉 It tells you what those numbers mean.
From Metrics to Meaning (Where This Tool Becomes Powerful)
Most tools stop at numbers.
This one goes further.
It gives you insights like:
👉 “Your ROAS is below break-even—this campaign is losing money”
👉 “Your CAC is too high—optimize before scaling”
👉 “Your campaign is profitable—increase budget”
This transforms raw data into decisions.
The Most Important Question: Should You Scale or Stop?
Every ad campaign leads to one decision:
👉 Scale
👉 Optimize
👉 Stop
But without proper analysis, this decision becomes emotional.
You might scale too early.
You might stop too soon.
This tool removes that guesswork.
Understanding Break-Even Point (Critical for Scaling)
One of the most overlooked metrics is break-even.
If your product costs $50 and sells for $100:
👉 You need at least 2x ROAS to break even
Anything below that:
👉 You’re losing money
The dashboard calculates this automatically.
Why Most Businesses Lose Money on Ads
It’s not because ads don’t work.
It’s because:
- They don’t track CAC properly
- They misunderstand ROAS
- They ignore profit
They scale based on revenue—not margin.
And that’s a dangerous mistake.
How This Tool Helps You Fix That
Once you understand your numbers, everything changes.
- Telegram Marketing
TexAPI Plus: The Smarter Way to Extract Telegram Members and Scale Your Growth System
Price range: 0.00$ through 39.00$ Select options This product has multiple variants. The options may be chosen on the product page - TikTok Marketing
TikTok Bot Pro : How TikTok Automation Tool Actually Helps You Grow
Price range: 0.00$ through 19.00$ Select options This product has multiple variants. The options may be chosen on the product page - Instagram Marketing
Instabot Pro – Instagram Bot & Automation Tool for Auto Followers, Likes & DM Growth
Price range: 0.00$ through 19.00$ Select options This product has multiple variants. The options may be chosen on the product page - Email Marketing
The Complete Guide to Lead Generation and Cold Email Marketing eBook PDF
Original price was: 5.00$.0.00$Current price is: 0.00$. Add to cart - Email Marketing
Social Network Data Scraper – Email Extractor & Lead Generation Tool
Price range: 0.00$ through 199.00$ Select options This product has multiple variants. The options may be chosen on the product page - Email Marketing
Atlas Bulk Email Sender | Powerful Unlimited SMTP Email Marketing Software for Windows
Price range: 0.00$ through 59.00$ Select options This product has multiple variants. The options may be chosen on the product page


You can:
- Identify losing campaigns instantly
- Improve targeting
- Optimize funnels
- Allocate budget smarter
You stop wasting money…
👉 and start controlling it.
The Hidden Opportunity: Improving Conversion Instead of Spending More
Most people think growth comes from increasing ad spend.
But often, the real opportunity is:
👉 improving conversion rates
If your funnel improves:
- Your CAC drops
- Your ROI increases
- Your profit grows
Without spending more.
How This Connects With Your Funnel Strategy
Your ad performance doesn’t exist in isolation.
It connects directly to:
- Your landing page
- Your offer
- Your follow-up system
If your ads are getting clicks but not conversions:
👉 the problem is not ads
👉 it’s your funnel
This is where combining this tool with your Conversion Optimization Suite becomes powerful.
From Guessing to Data-Driven Decisions
Without this tool:
- You rely on intuition
- You react to numbers
- You make inconsistent decisions
With this tool:
- You understand your performance
- You identify weak points
- You make confident decisions
That’s the difference between random growth and strategic scaling.
The Emotional Side of Ad Spending
Let’s be honest—running ads can be stressful.
You’re spending money daily.
And you don’t always know if it’s working.
That uncertainty creates hesitation.
But when you have clear metrics:
- You know your risk
- You know your limits
- You know your opportunity
That clarity reduces stress.
Why High-Performing Marketers Track These Metrics Daily
Top marketers don’t guess.
They monitor:
- CAC
- ROAS
- ROI
Because these numbers tell them:
👉 where to scale
👉 where to optimize
👉 where to stop
This is what separates amateurs from professionals.
Turn Your Ads Into a Predictable Growth Engine
When you understand your acquisition cost and ROI:
- Your campaigns become predictable
- Your scaling becomes controlled
- Your growth becomes sustainable
You stop gambling…
👉 and start engineering results.
Start Tracking Your Real Performance Today
Your ads are already running.
Your data already exists.
The only question is:
👉 Are you analyzing it properly?
Use this Acquisition Cost & ROI Dashboard to calculate your customer acquisition cost, understand your ROAS formula, and track your real profitability.
Because in advertising…
👉 Revenue looks good.
👉 But profit is what matters.
